Web Debugger
Overview
The Web Debugger lets you inspect HTTP requests and responses flowing through your tunnel in real time. You can watch live traffic, view headers and payloads, and modify and replay requests to debug web applications or APIs hosted on localhost.
The easiest way to use it is straight from the Pinggy dashboard in your browser. There is nothing to install or configure, and it works for free tunnels too (you just need a free token).
Web Debugger from the Dashboard
Start a tunnel with your token. Any HTTP/HTTPS tunnel started with a token shows up in the dashboard.
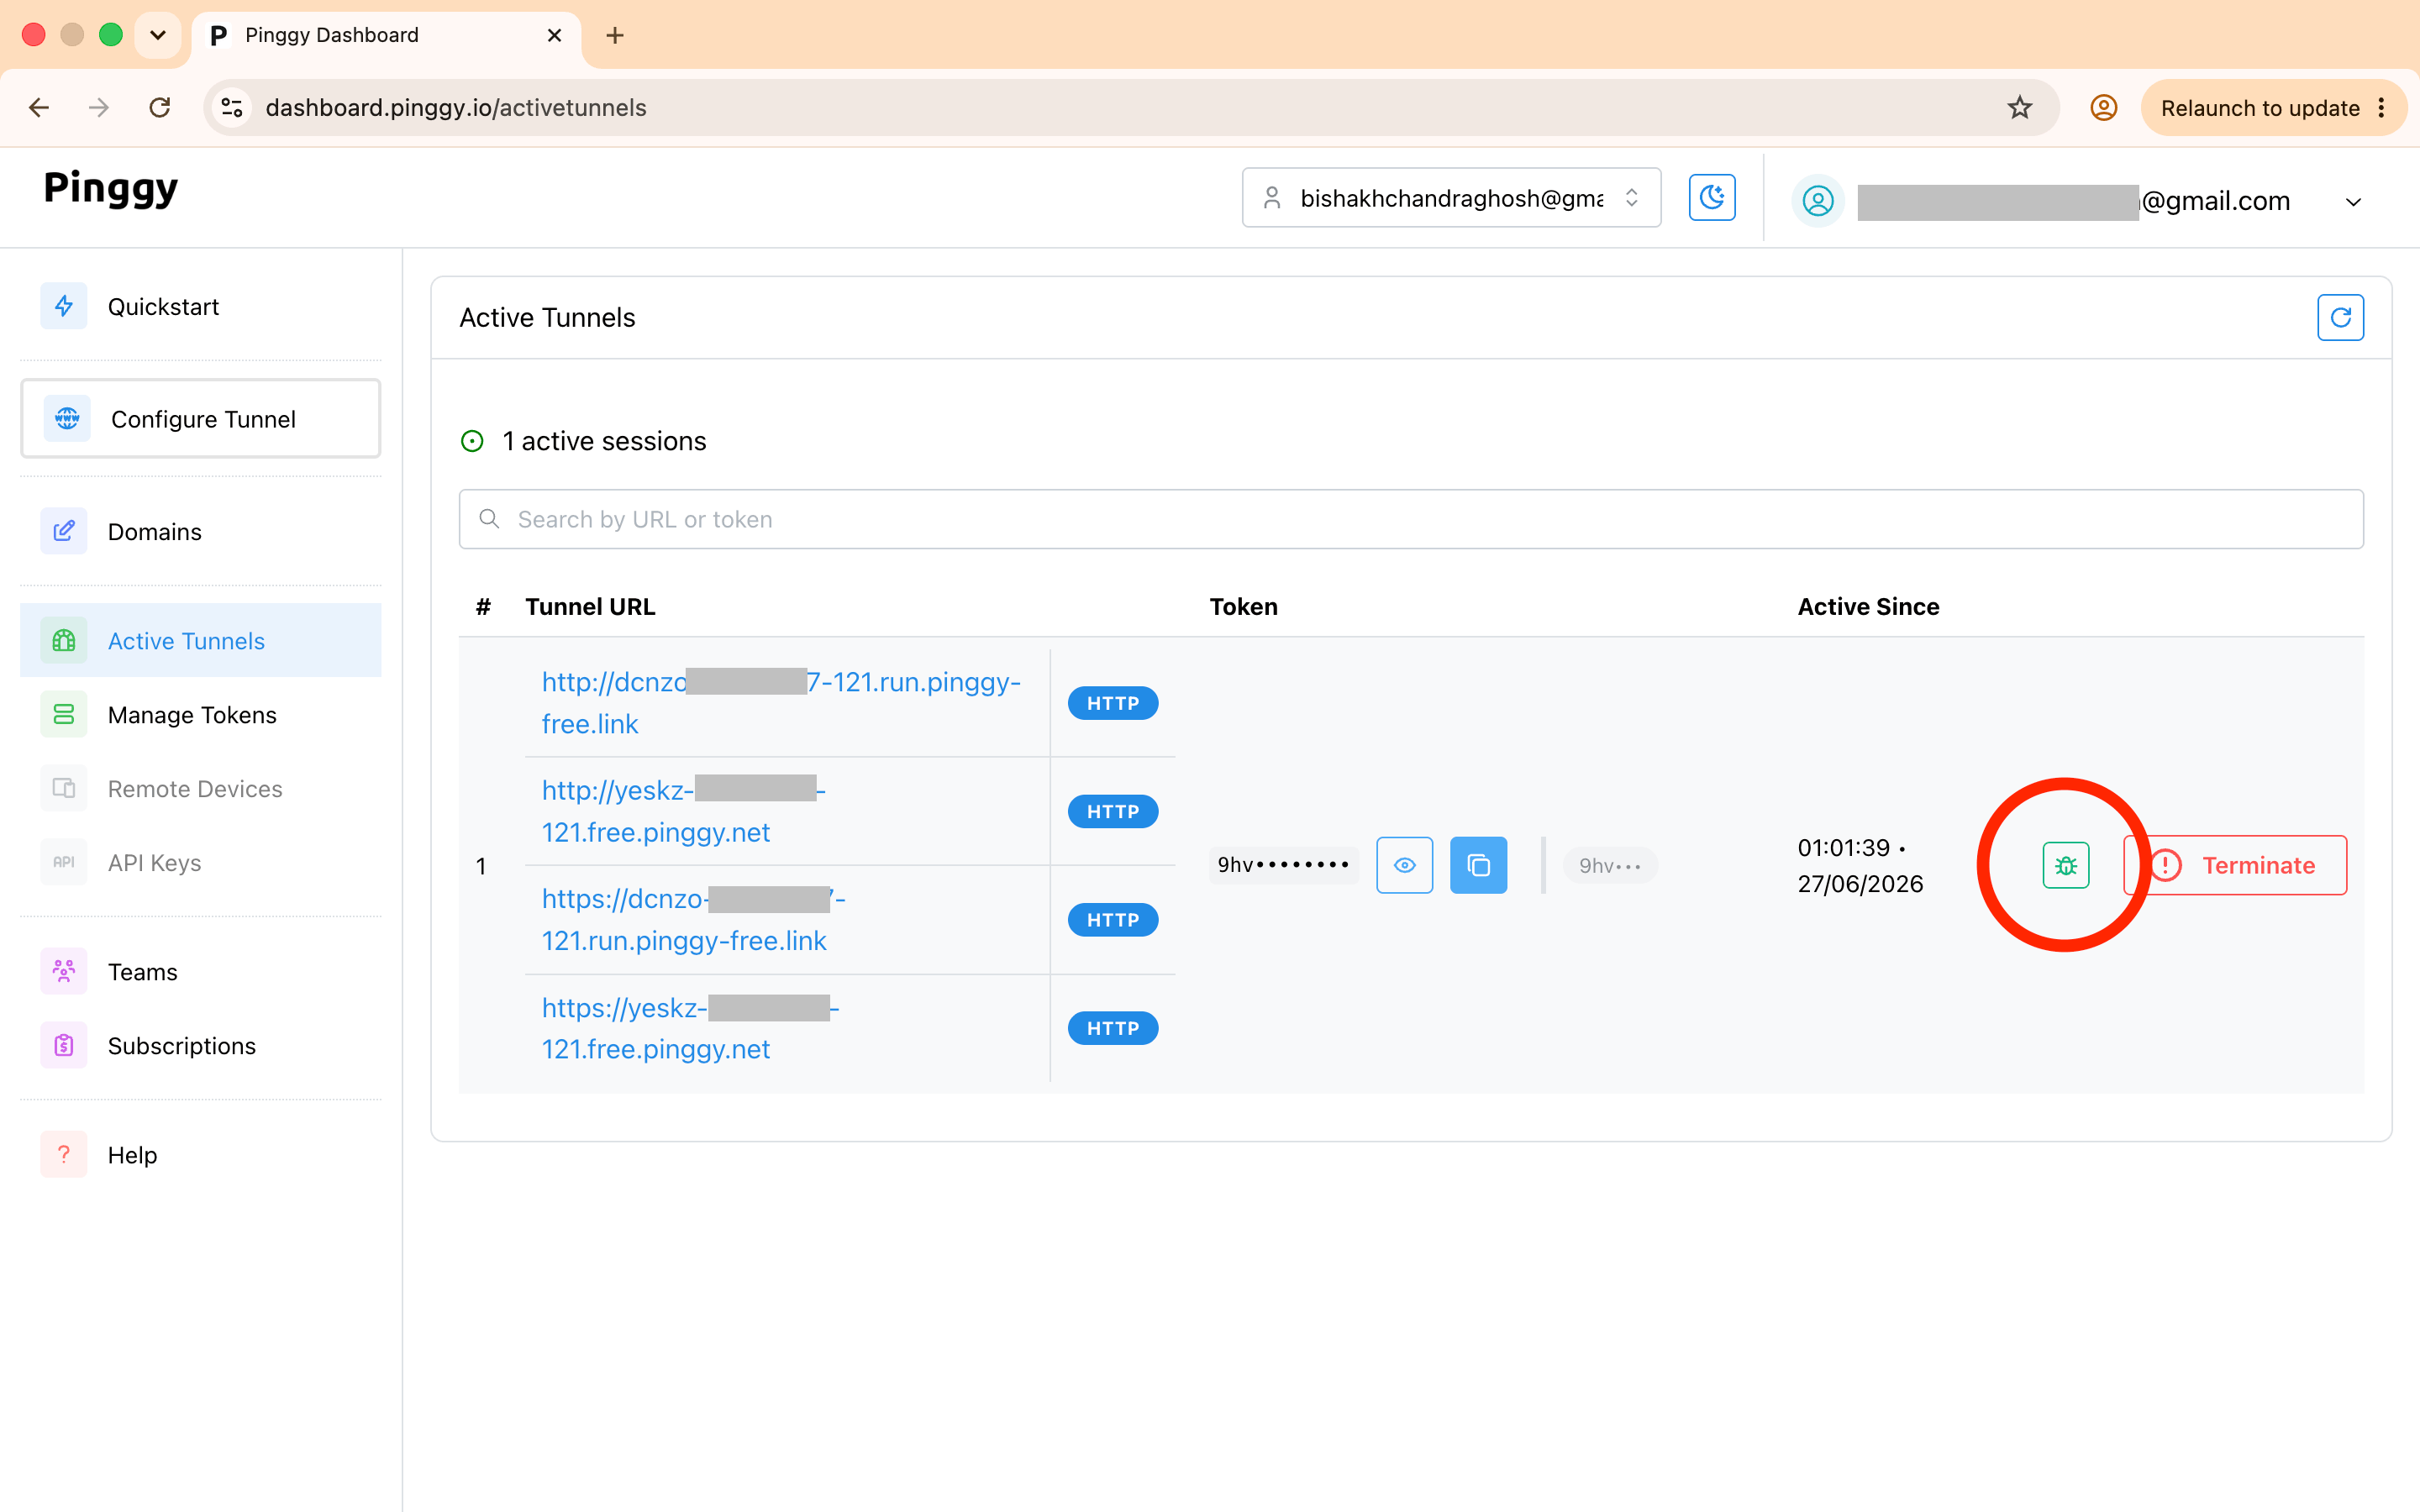
Open the Active Tunnels page. Each running tunnel is listed with its URLs and token. Click the debug icon on the row for the tunnel you want to inspect.
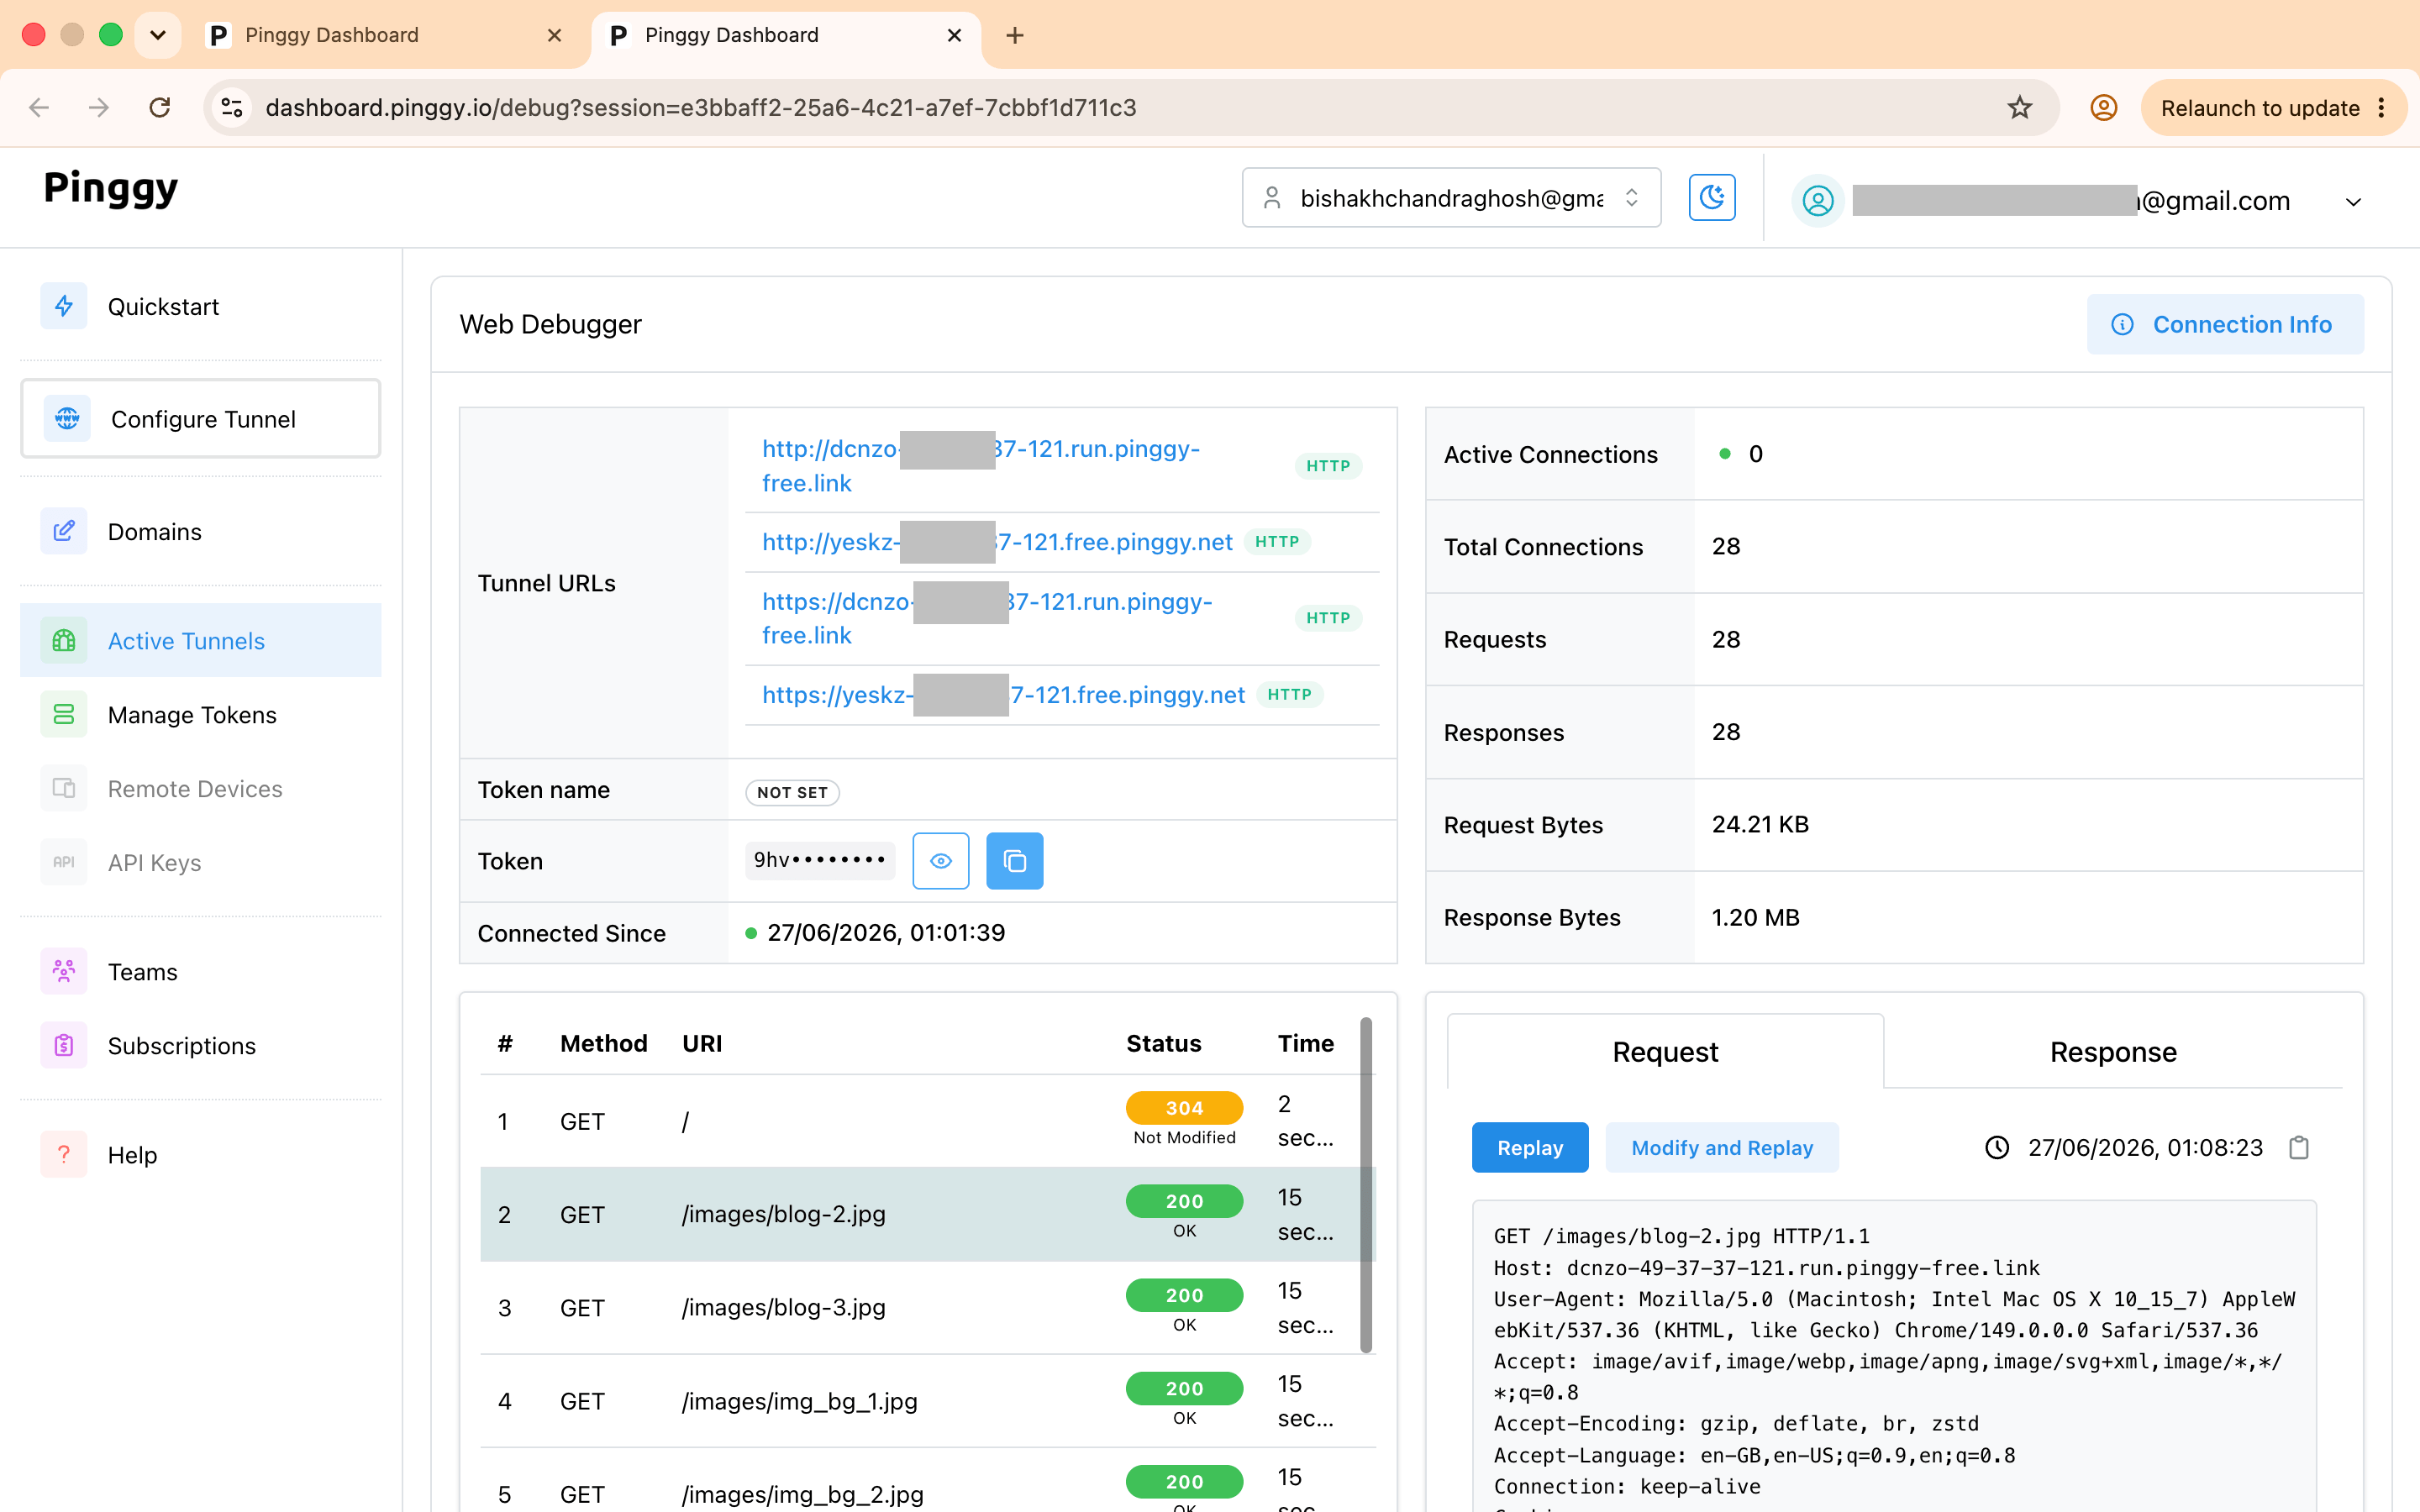
Inspect live traffic. The Web Debugger opens with the tunnel’s URLs, connection stats (total connections, requests, responses, bytes transferred), and a live list of requests. Click any request to see its full headers and body, and switch between the Request and Response tabs.
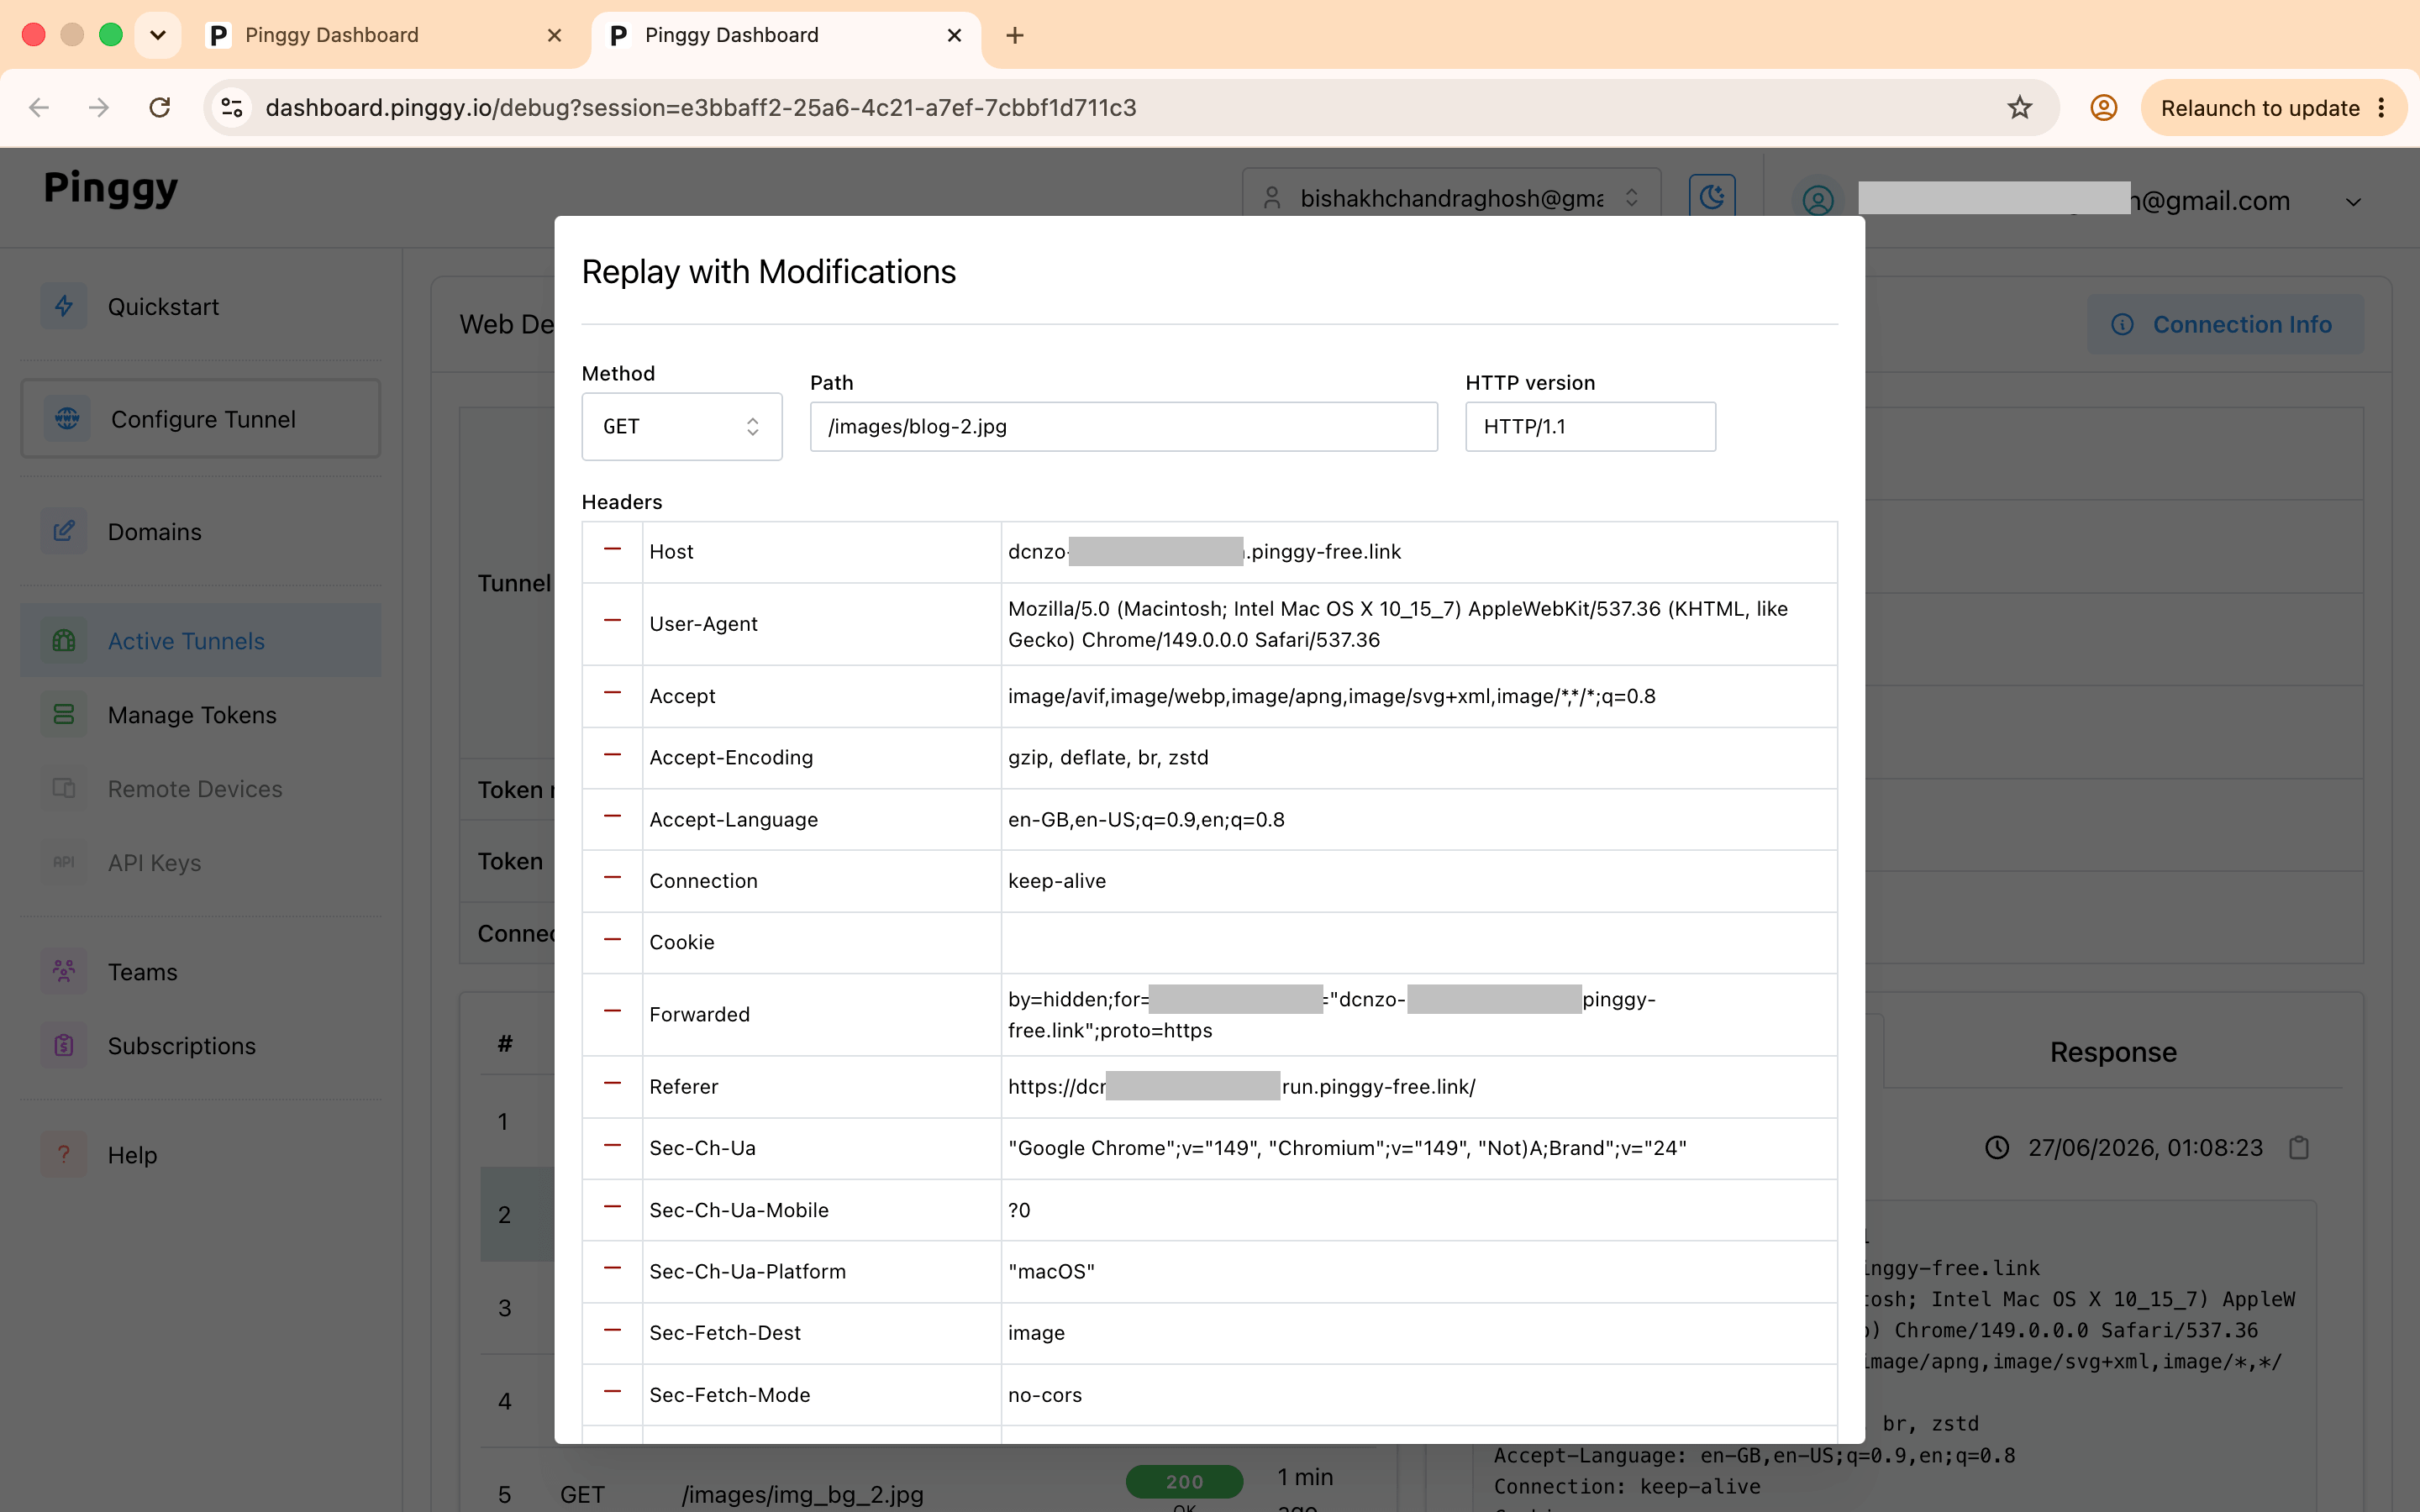
Replay or modify requests. Use Replay to re-send a request as-is, or Modify and Replay to change the method, path, HTTP version, and any headers before sending it again. This is handy for reproducing a bug or testing how your app handles a tweaked request.
Running the Web Debugger on a Local Port
You can also run the Web Debugger locally instead of using the dashboard. Forward a local port to the debugger when you start the tunnel and open it in your browser. This works without signing in.
Start a tunnel with the Web Debugger port. Add -L4300:localhost:4300 to forward the debugger to local port 4300:
ssh -p 443 -R0:localhost:8080 -L4300:localhost:4300 free.pinggy.io
You can map it to a different local port if 4300 is taken, e.g. -L9999:localhost:4300 makes the debugger available on port 9999.
Open the debugger at http://localhost:4300 to see live request and response data.
Using the Pinggy CLI instead of ssh:
./pinggy -p 443 -R0:localhost:8080 -L4300:localhost:4300 free.pinggy.io
Programmatic access with APIs. Retrieve tunnel URLs by sending a GET request to http://localhost:4300/urls. Example response:
{
  "urls": [
    "http://rnckk-23.4.5.6.run.pinggy-free.link",
    "https://rnckk-23.4.5.6.run.pinggy-free.link"
  ]
}
To get the list of whitelisted IP addresses, send a GET request to http://localhost:4300/ipwhitelist.
Features
- Live Request Inspection: View incoming HTTP requests, including headers, methods, and payloads.
- Response Monitoring: Inspect server responses, including status codes and response headers.
- Modification and Replay: Modify HTTP requests, including all headers, and replay them to debug your applications.
- Browser and Local Access: Use the debugger from the dashboard or run it on a local port.
- Zero Trust Mode: If you do not want Pinggy to read your data, then use
TLS tunnels. This will create end-to-end encrypted connections from the browser to your local HTTPS servers. Pinggy or any other actor cannot read your data, maintaining privacy.